Rural Health Mapping Tool


The Rural Health Mapping Tool includes COVID-19 data for communities across the United States.
Accurate, up-to-date data are critical when choosing public health strategies that meet a community’s needs.
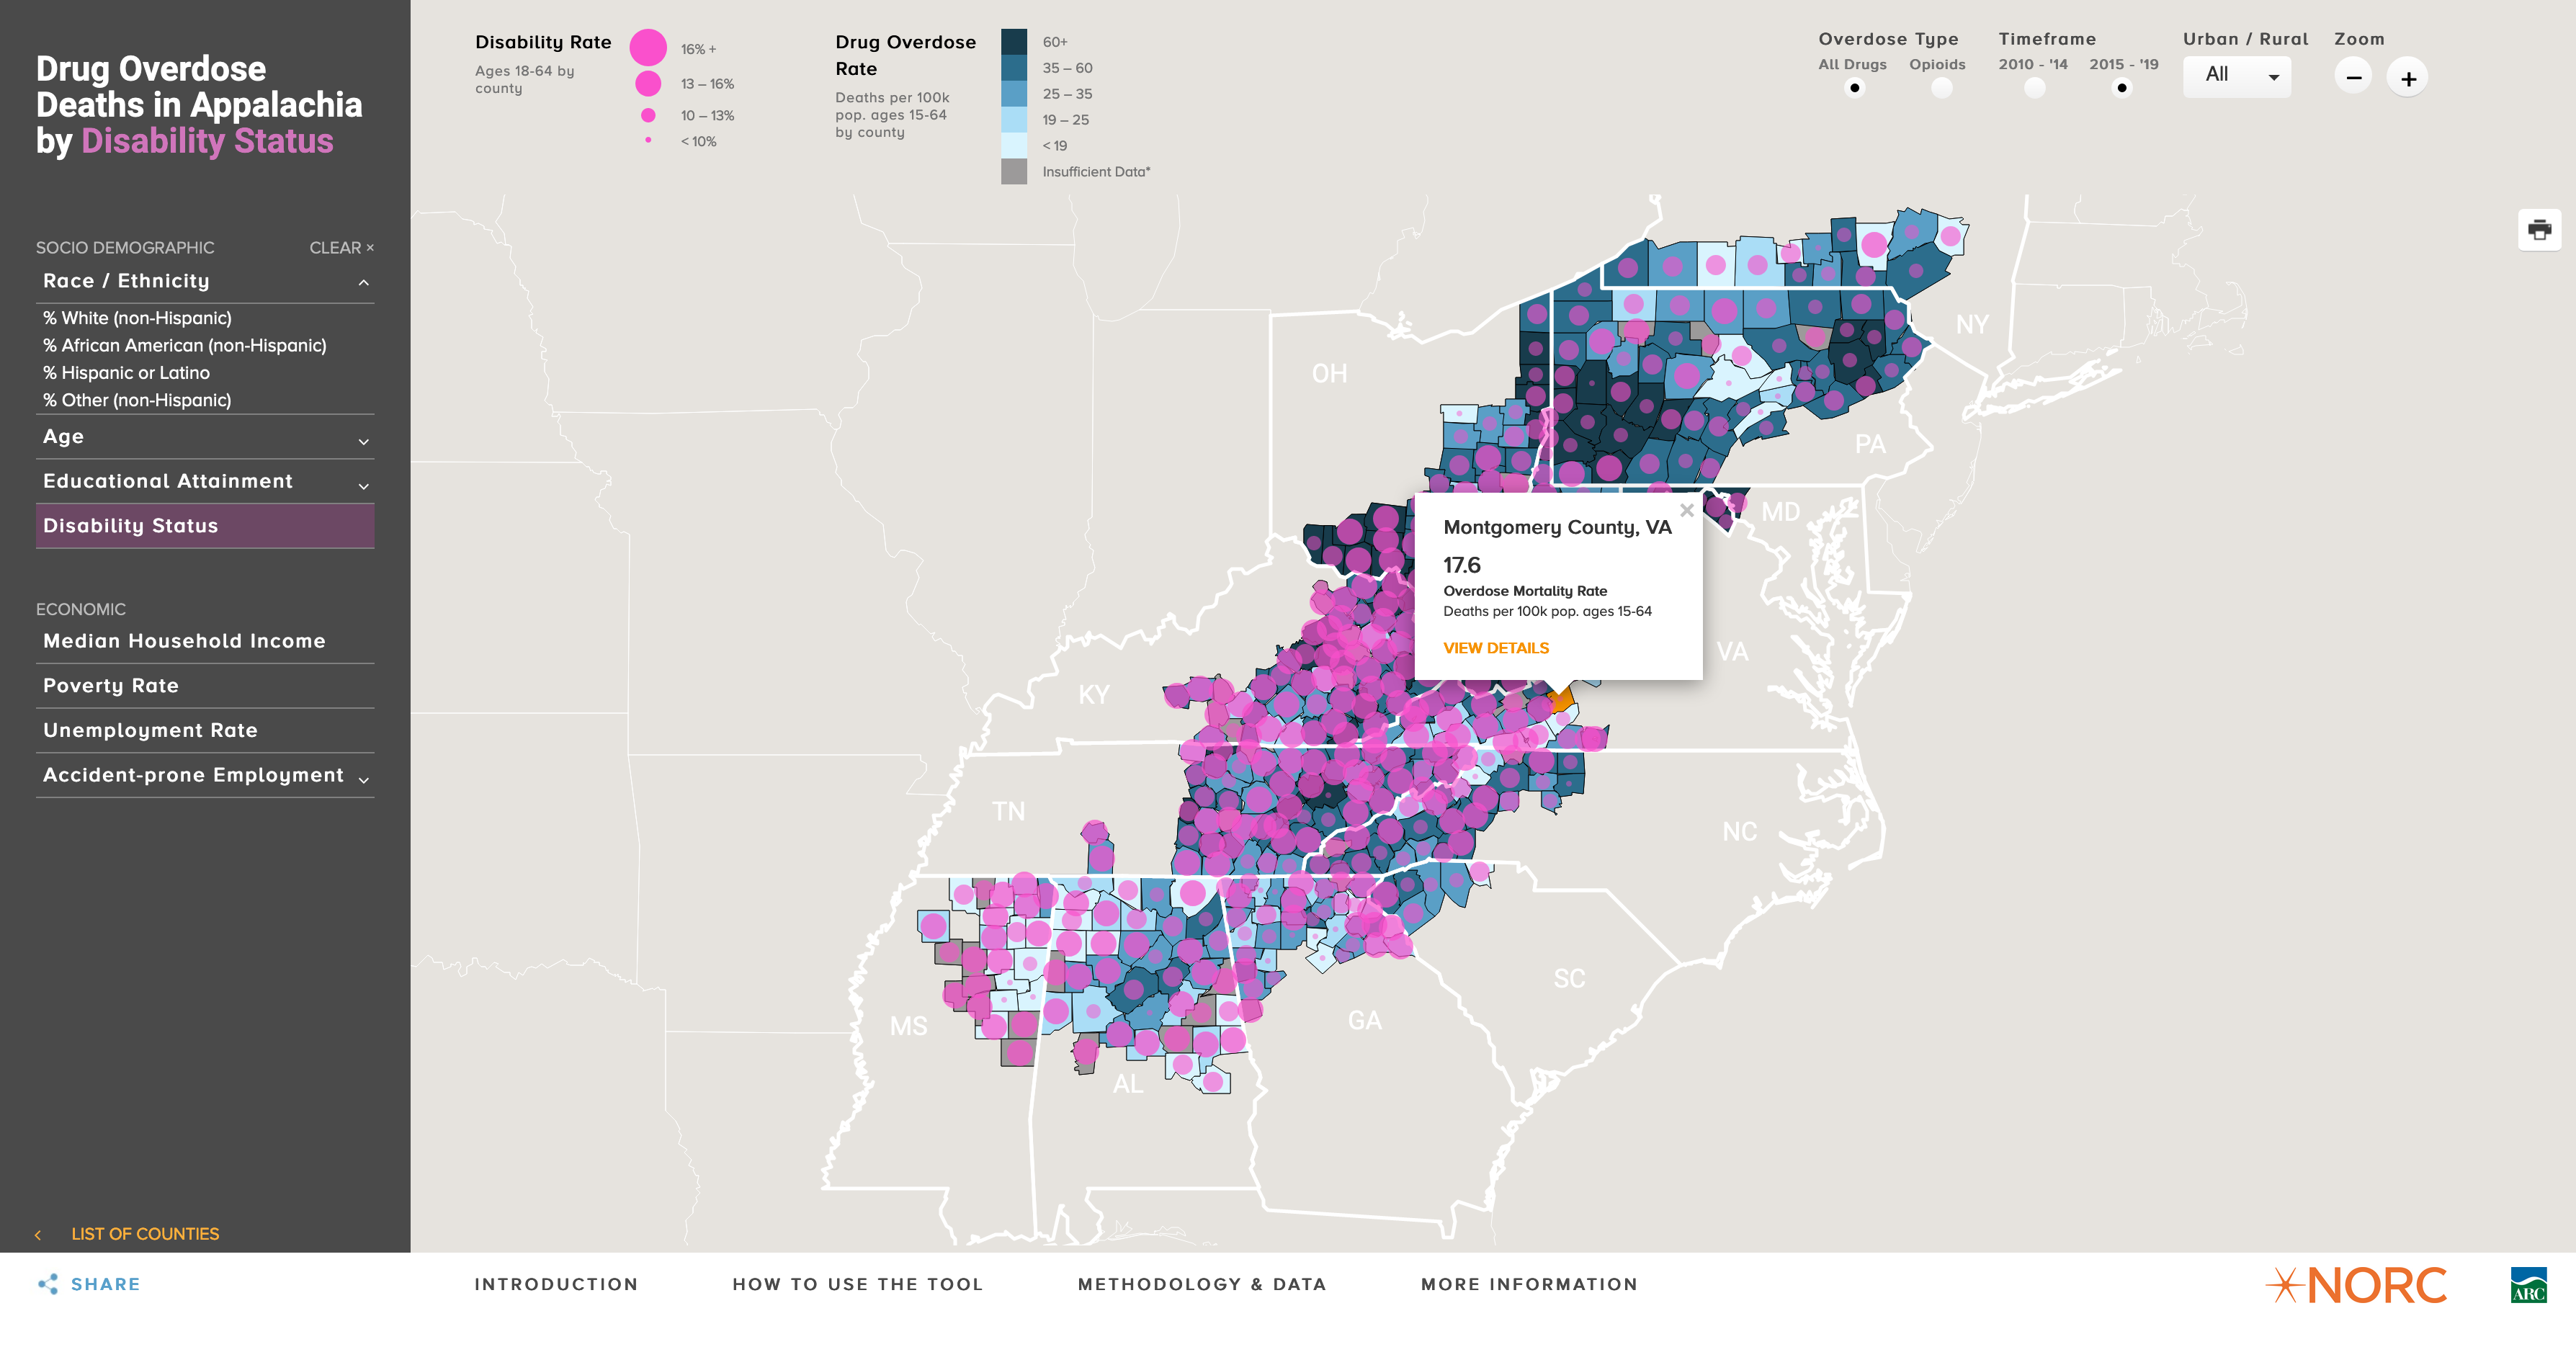
COVID-19 vaccination rates may be influenced by a variety of factors, and it is often challenging to access all relevant data in a single tool. With funding from the Centers for Disease Control and Prevention (CDC), NORC developed the Rural Health Mapping Tool. The publicly available tool provides information on COVID-19 vaccination rates, COVID-19 cases and hospitalizations, and other health and sociodemographic information in communities across the United States. The tool integrates several measures of health and prosperity into a single tool, providing a comprehensive picture of the well-being of rural communities.
This tool allows the CDC, other researchers, community organizations, local policymakers, and the public to create county-level maps illustrating the relationship between COVID-19 vaccination coverage rates and other health outcomes, socio-demographic, and economic variables across all counties of the United States.
The Rural Health Mapping Tool offers benefits beyond the COVID-19 pandemic. It integrates several measures of health and prosperity into a single tool, providing a comprehensive picture of the well-being of rural communities.
The interactive tool was created in JavaScript using the Leaflet library. Data were processed using SAS and converted from shapefile to TopoJSON using the sf library in R. Several data sources were accessed in the development of this tool. Some functionality to improve accessibility of the tool remains in development and will continue to be enhanced.

This visualization was created by NORC’s VizStudio, a creative community of experts who turn complex data into compelling visual stories.


