Obesity Prevalence & Comorbidity Map

Problem
Millions of people across the United States are living with obesity.
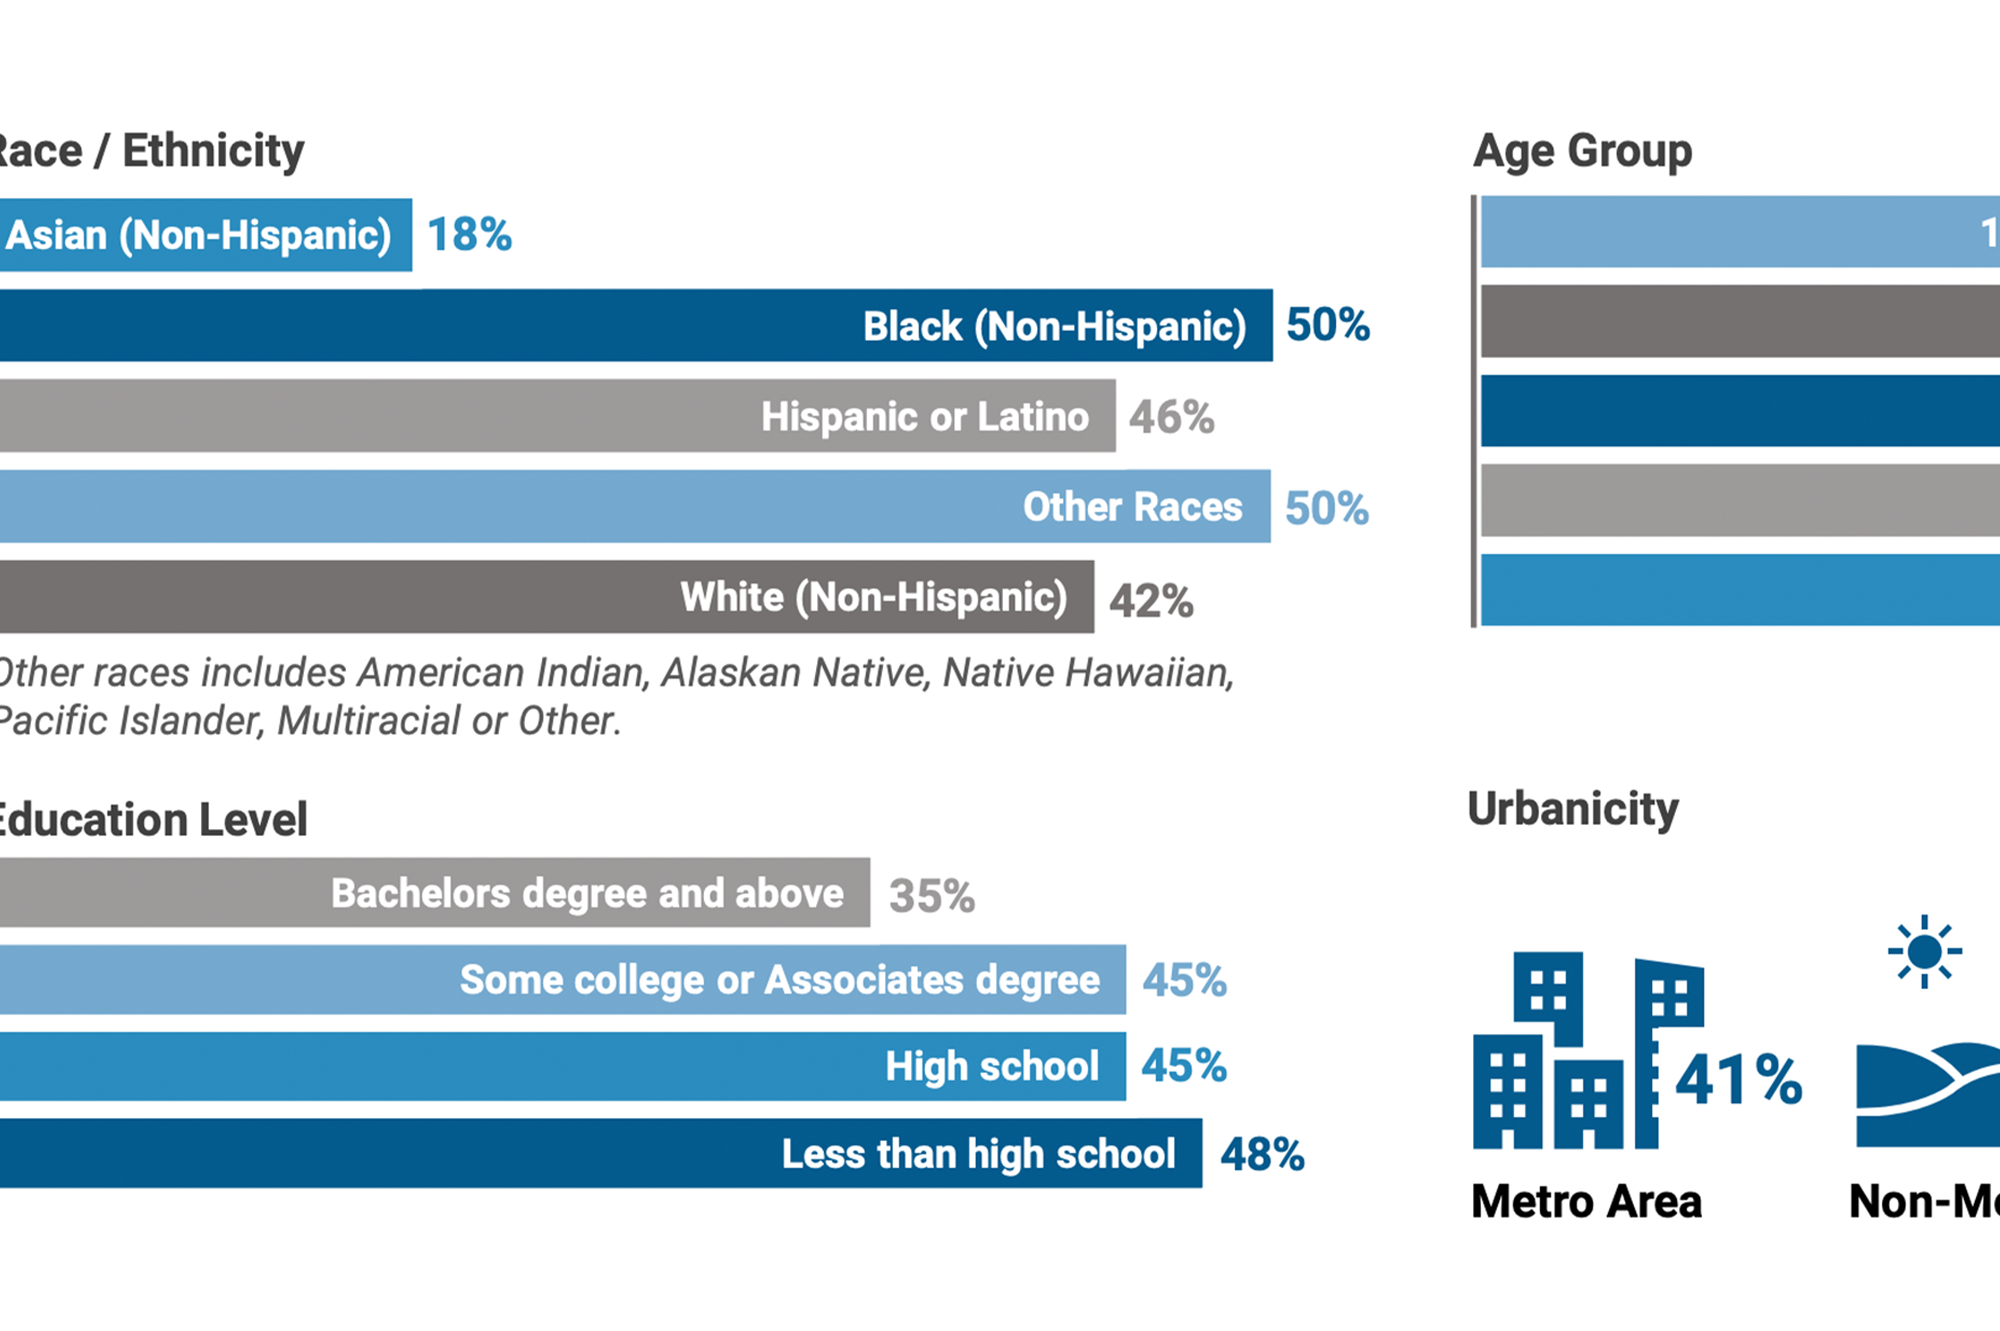
Obesity is a chronic and complex disease that is correlated to many other serious, chronic, and costly diseases. Over the last decade, obesity rates have continued to steadily increase. Importantly, prevalence of obesity varies considerably based on certain demographic and socioeconomic factors, including age, race, and education level.
As the prevalence of obesity continues to rise in every state across the U.S., it is important for researchers and policymakers to understand how obesity interacts with other diseases as well as to understand differences between subpopulations across the U.S.
Solution
An easy-to-use interactive tool.
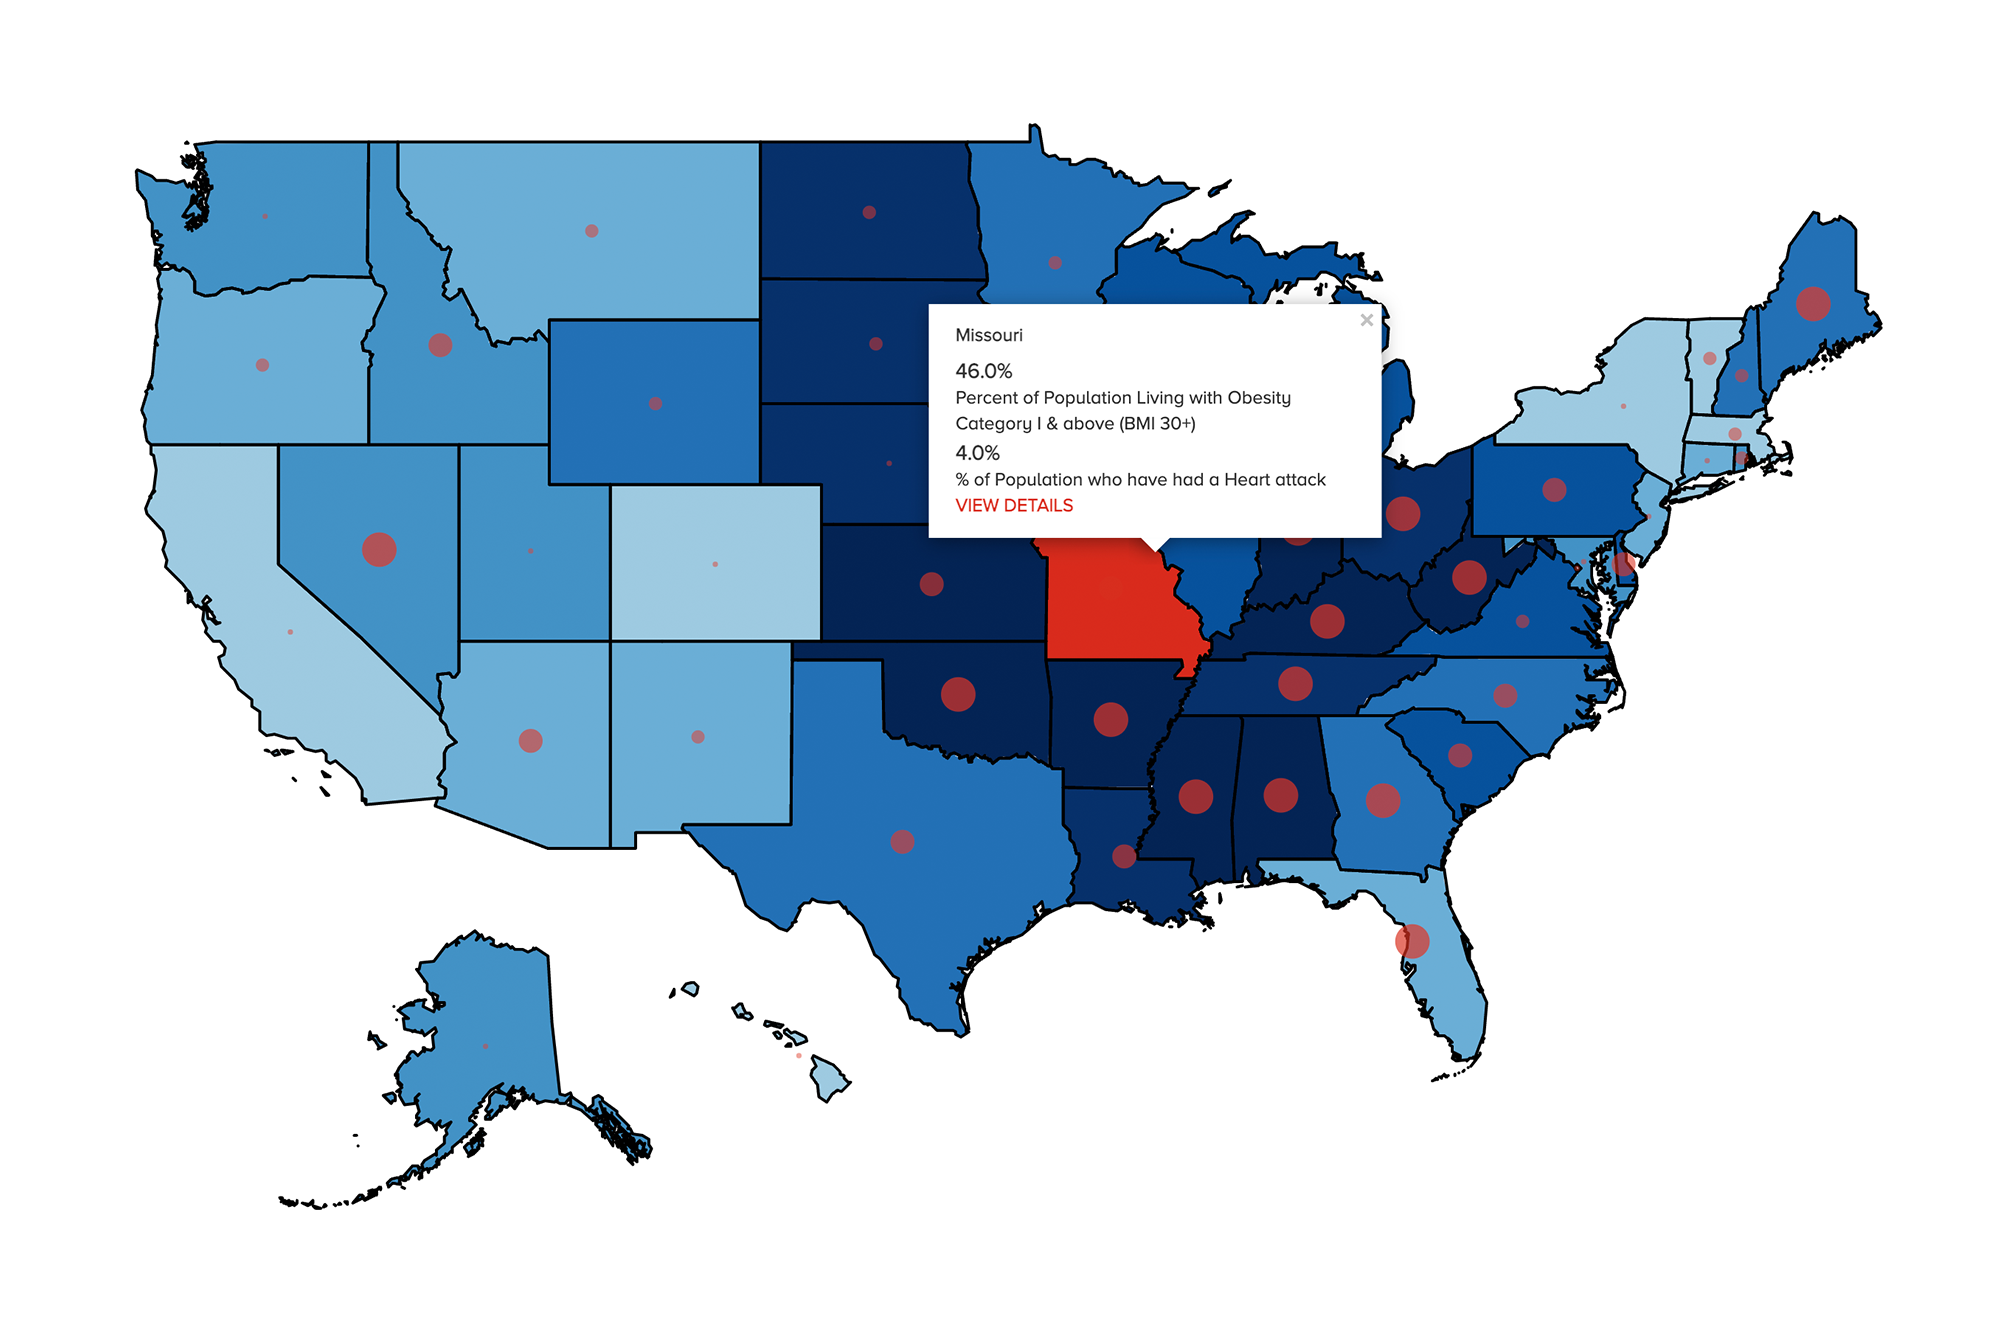
To demonstrate the relationship between obesity and related diseases, and incorporate sociodemographic characteristics, NORC developed an online interactive mapping tool that allows users to visualize these relationships.
The mapping tool visualizes the prevalence of obesity at the state-level and allows users to overlay prevalence of one of nine related diseases. In addition, users can create subpopulations of the U.S. by selecting from five sociodemographic characteristics including sex, age, race/ethnicity, urbanicity, and education level. As user’s change the population, the visualization updates to provide estimates for the selected population, providing understanding and quick access to data for how prevalence of obesity and related diseases changes by subpopulation and by state.
This mapping tool allows users to easily understand and see state-level and subpopulation variation in rates of obesity and related diseases.
Result
A data tool for researchers, policymakers, and the public.
Using the Centers for Disease Control and Prevention’s Behavioral Risk Factor Surveillance System (BRFSS) data from 2013 through 2021, this interactive mapping tool contains over one million estimates of prevalence of obesity and nine related diseases. The analysis found:
- Nearly 1/2 of U.S. adults are living with obesity: In 2019-2021, 42% of adults in the U.S. were living with obesity.
- Obesity impacts every U.S. state: At least 1/3 of adults in every state, plus Washington D.C., are living with obesity.
- Prevalence of obesity varies by state: Washington D.C. has the lowest prevalence of obesity at 33%, while nearby West Virginia has the highest prevalence of obesity at 51.1%.
- Sociodemographic factors impact prevalence of obesity: Minority populations, people in rural settings, and those with lowest level of education have the highest obesity rates in the U.S.
This mapping tool can be used to better target treatment and policy solutions, which are crucial in improving health outcomes.
Learn More About the Study
Use the interactive mapping tool to view estimates for prevalence of obesity and comorbidities at the state level.
Related Tags
Project Leads
-
Dianne Munevar
Vice PresidentProject Director -
Matthew Brault
Senior Research ScientistAnalytics Lead -
Peter Herman
Research MethodologistMethodology Lead


